Hooked Protocol’s price analysis shows rising signs as the market shows massive upside potential. The price has increased, reaching above the $1.42 level, and could soon break out of the key resistance levels to surge even higher if the bullish momentum continues. The bulls have regained their control of the HOOK market, which will change the course of the market for the better, and now expect the bullish period to take over in the next few days. The bullish momentum is strong, with a 24-hour volume of $9.4 million, an increase of 0.03% over the past 24 hours, and could continue increasing as investors look to capitalize on potential price breakouts. The market capitalization is currently at $70 million, with an increase of 1.46% in the past 24 hours, as per Hooked Protocol data.
Hooked Protocol price analysis 1-day chart: Bulls succeed in raising the price to $1.42
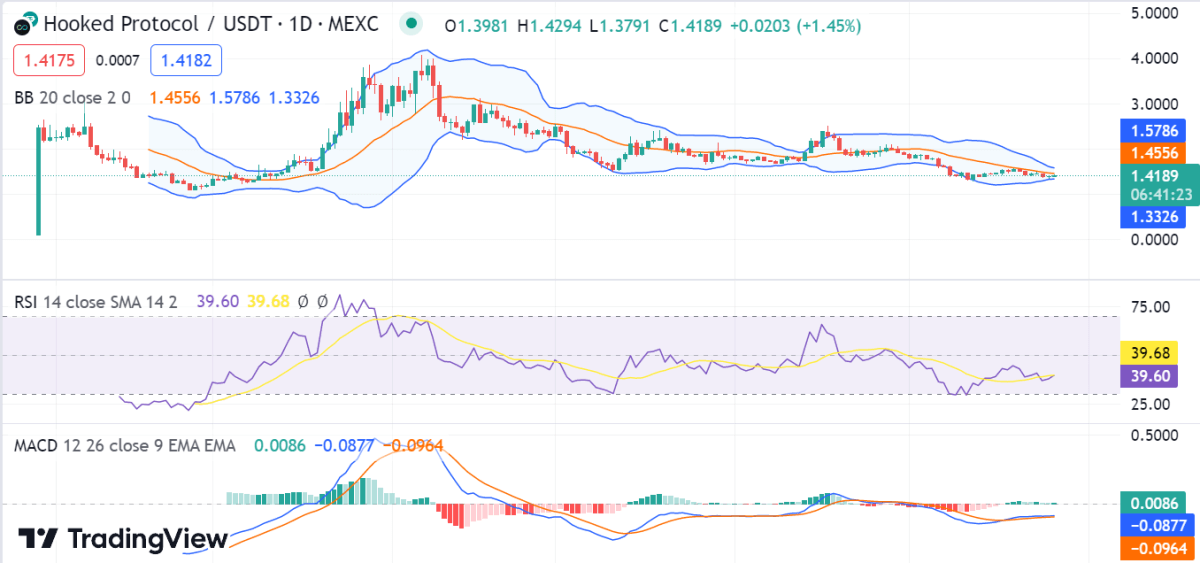
Looking at the daily chart, we can see that Hooked Protocol’s price is currently in a bullish trend. The prices are trading along with the ascending channel, and a breakout from the current range could set the tone for the next move. The buyers are currently in control as the prices are trading above the moving averages.

The buying activity has heated up during today’s trading session, with the Bollinger Bands widening. The upper band is seen to be at $1.5786, with the lower band at $1.3326 and the middle line at $1.4556, indicating increased volatility in the market. The Relative Strength Index (RSI) score is increasing at a faster rate and has reached an index of 39.60, which indicates that the market is in oversold territory. The MACD line in blue is above the signal line in red, indicating that the bulls have the momentum to push prices higher.
HOOK/USD 4-hour price chart: Recent developments and further technical indications
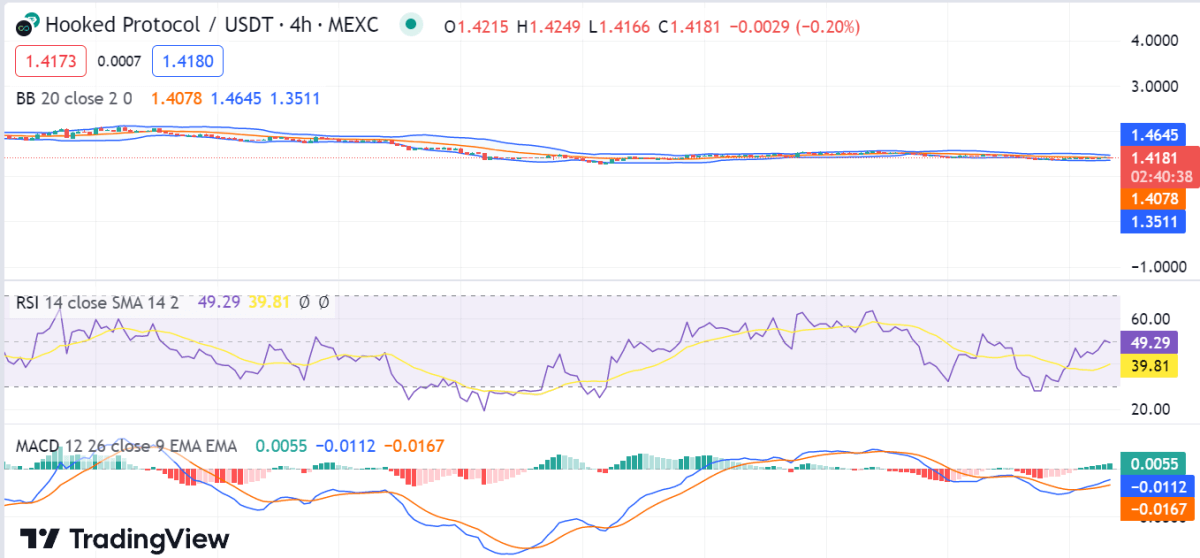
On the 4-hour Hooked Protocol price analysis and hourly timeframes, the bulls have taken a breather, and the price is seen consolidating above the $1.42 level. Buyers need to sustain their buying interest and break above the key resistance level of $1.43 in order for further gains to be made over the medium term.

The technical indicators on the hourly chart show positive market sentiment, with the Relative Strength Index at 49.29 indicating that it is now in a neutral position, neither overbought nor oversold. The moving Average Convergence Divergence oscillator shows a bullish divergence. The highest level of resistance for HOOK indicated by the Bollinger band is at $1.4645. The bottom limit of the Bollinger band, which stands for the strongest support for the meme cryptocurrency, is currently around $1.3511.
Заключение ценового анализа Hooked Protocol
To sum up, Hooked Protocol price analysis indicates bullish momentum holding at $1.42, with over a 1.49% daily increase in price seen over the last 24 hours. The digital asset is currently trading at a key junction, and a breakout from either side of the range could set the tone for the next move. Traders should keep an eye out for any potential breakouts above this level. The technical indicators show positive market sentiment.
Заявление об ограничении ответственности. Предоставленная информация не является советом по торговле. Cryptopolitan.com не несет ответственности за любые инвестиции, сделанные на основании информации, представленной на этой странице. Мы настоятельно рекомендуем провести независимое исследование и / или проконсультироваться с квалифицированным специалистом перед принятием каких-либо инвестиционных решений.
Источник: https://www.cryptopolitan.com/hooked-protocol-price-analysis-2023-05-26/
